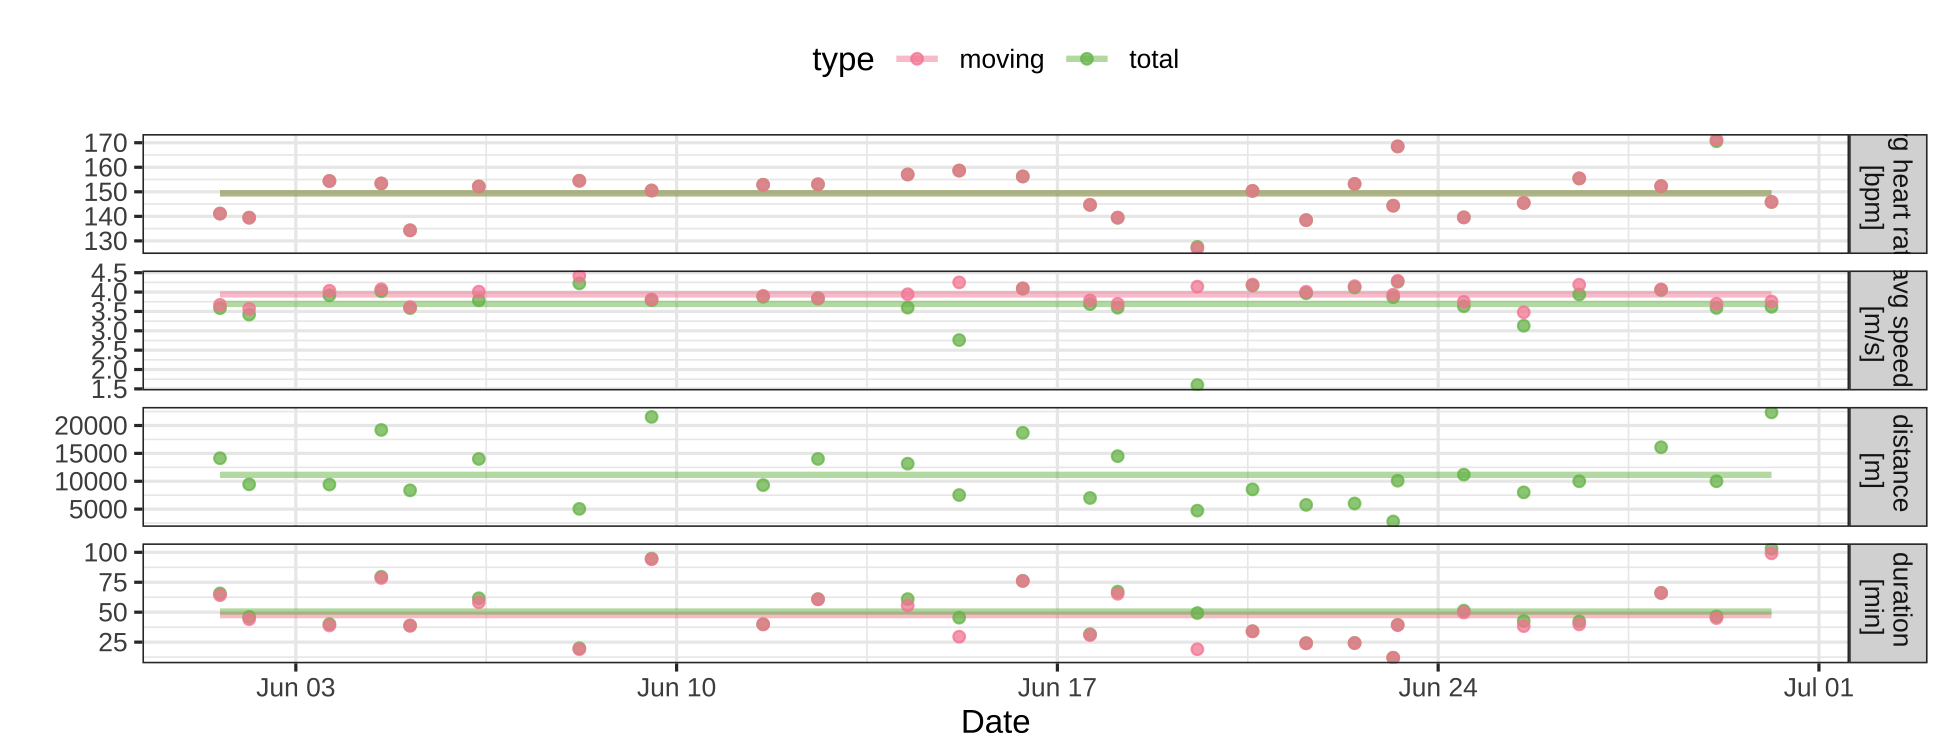
Identify the components of the grammar of graphics
Identify the components (2)
Scatter plot: Data
- Call the
ggplotfunction and pass in a data frame.
ggplot(df)
Scatter plot: Aesthetic mappings
- Pass the aes function with the mapping as a second argument.
ggplot(df, aes(x=AST, y=TOV))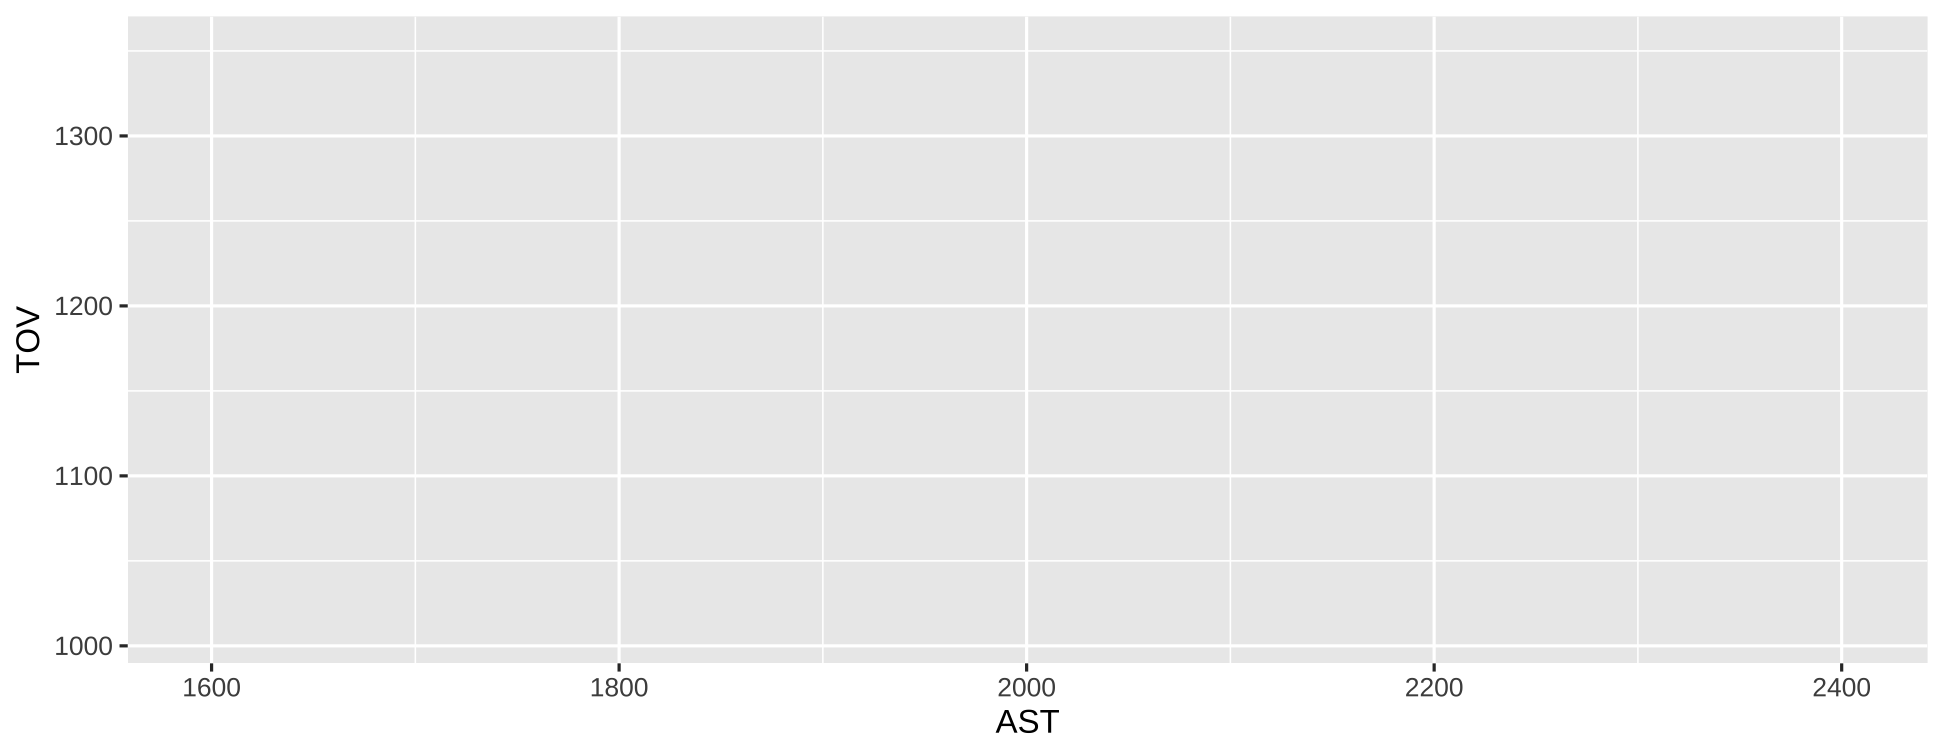
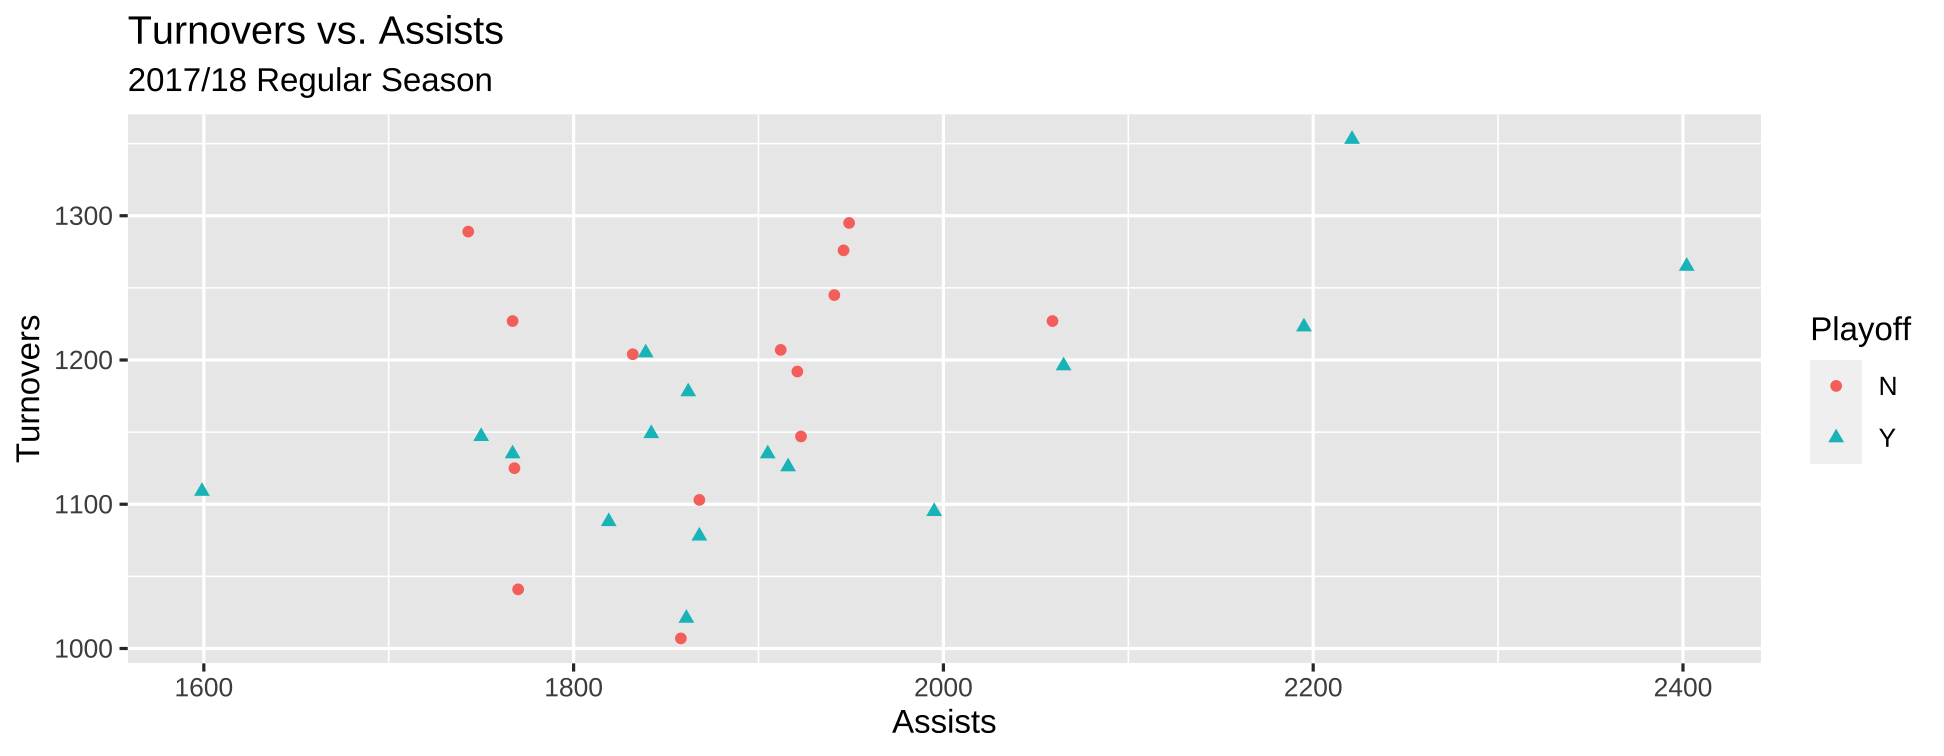
Scatter plot: Geoms
- Add a layer to use one point to represent one row.
ggplot(df, aes(x=AST, y=TOV)) + geom_point()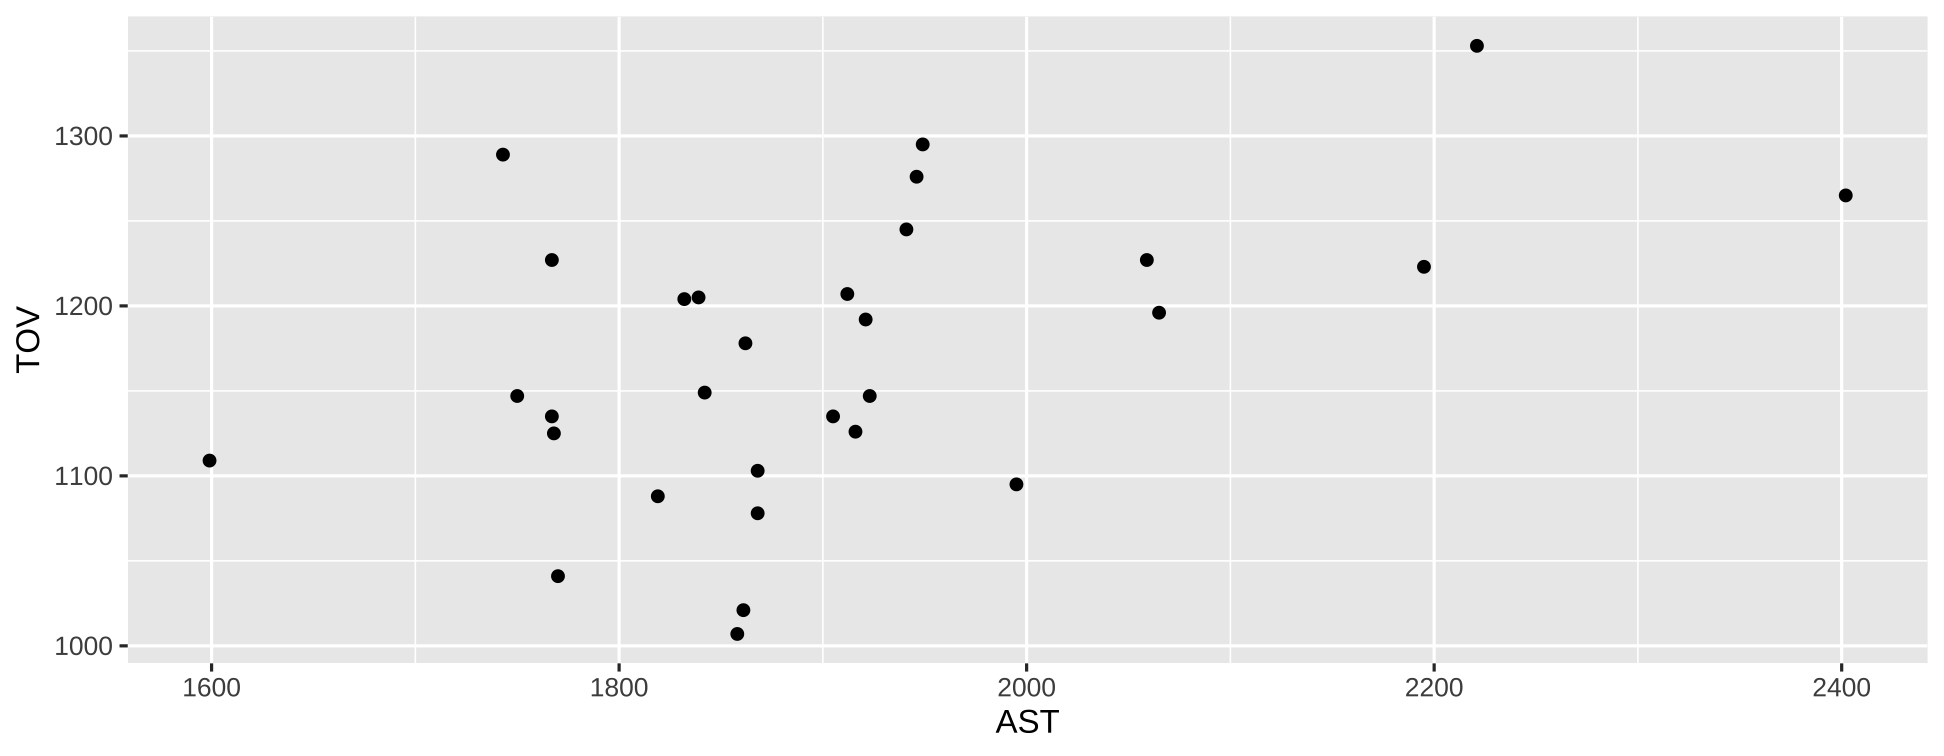
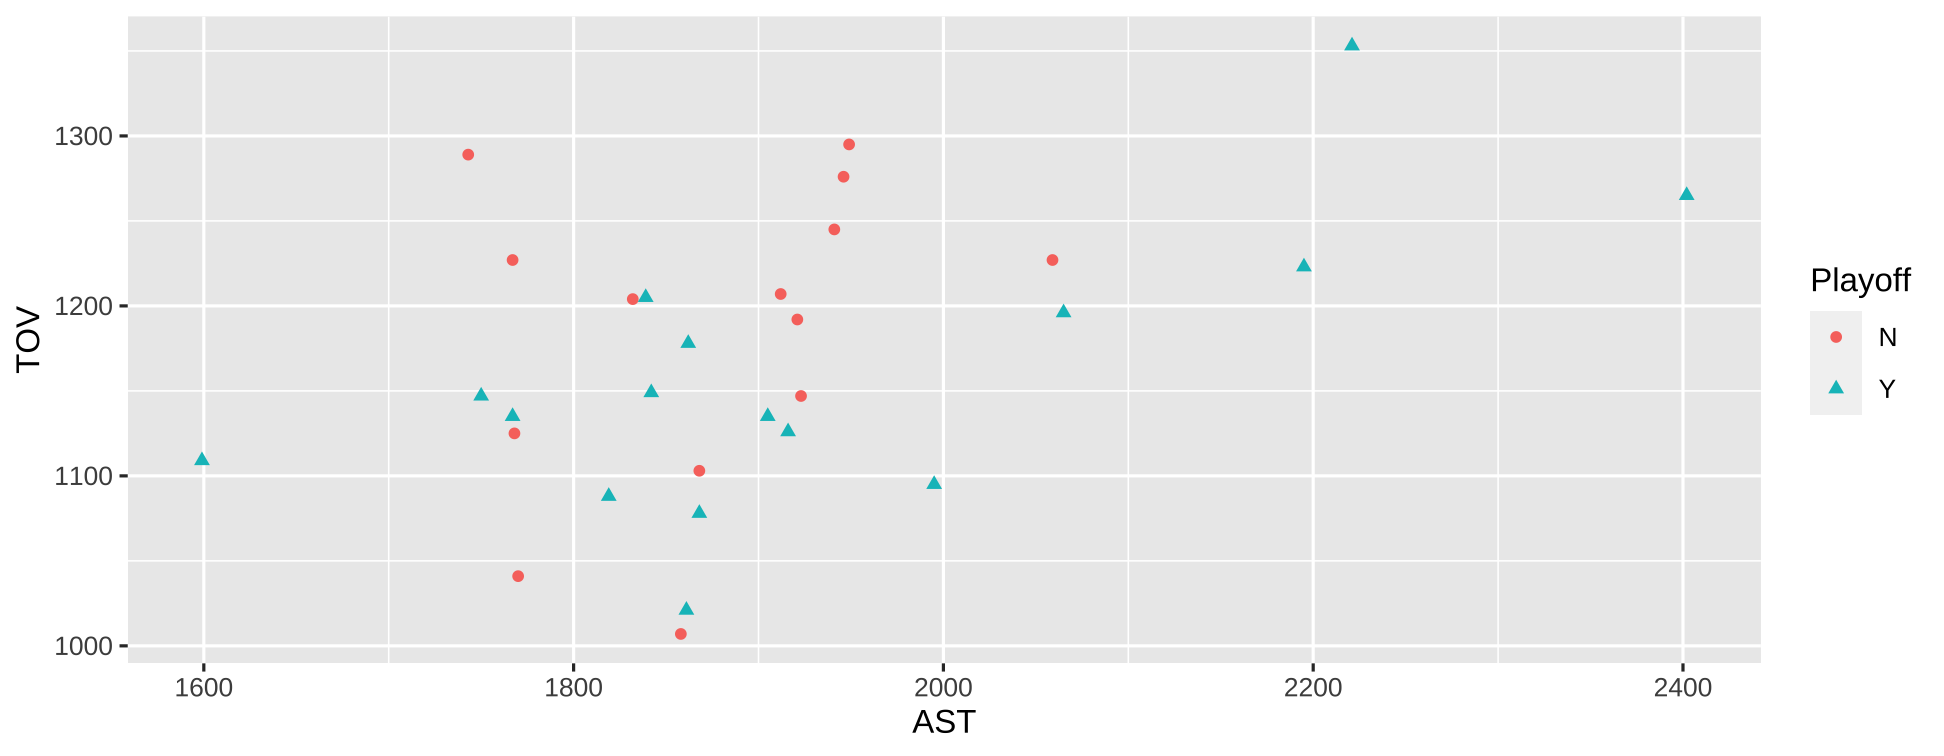
More mappings:
- Shape and color
ggplot(df, aes(x=AST, y=TOV, color=Playoff, shape=Playoff)) + geom_point()